|
Toward modelling Cabreo land productivity quality in Malta.
A short report Dr Gianmarco Alberti (Research Support Officer) Dr Reuben Grima Dr Nicholas Vella The data Soon after the development of the first (provisional) Cabreo model for Gozo (described in this same website -LINK-), it has been decided to extend the exercise to Malta. Through the courtesy of the National Archive of Malta, and in particular of the National Archivist Mr. Charles Farrugia, the complete Cabreo collection for Malta has been made available to the Department of Classics and Archaeology in November 2014. For the same reasons detailed in this website's 2014 Report, the Cabreo data will be used as basis for the development of a Logistic Regression model within a GIS environment to assess which environmental, topographic, and/or human-related factor may have had a role (if any) in the "determining" the quality of the land productivity as recorded in the Cabreo. Sampling strategy As a preliminary step, the Cabreo dataset has been scrutinized in order to have a general understanding of the area covered by the maps, as well as of the quality of the documentation itself. The latter comprised about 550 parcels, acquired as medium-quality raster images, and was actually including maps of (a) extremely small tenements, and (b) of isolated building or farmhouses. Unfortunately, (c) some of the images showed altered colors as to the key to the land productivity quality. |
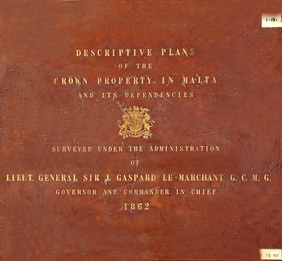
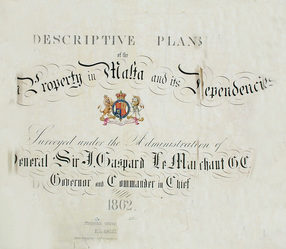
Cabreo's front covers
|
|
Due to time constrains, and in consideration of the fact that the Cabreo maps were to be georeferenced and digitized into ArcGIS, it was decided to draw a manageable sub-sample for the purpose of the model building. Upon further speculations, in order to get a sub-sample in which each of the three macro-areas in which Malta can be divided (namely, south-east-central, northern, and western part) could have the same probability of being chosen, it was decided to perform a random sampling stratified across the three macro-areas. This implied to preliminary build in Excel a list of all the suitable maps (excluding the aforementioned a, b, and c cases, for a resulting total of about 250), adding a key defining the macro-area to which each individual map belonged, exporting the resulting dataset into another stats toolpack (namely, JMP), and to draw a stratified random sample corresponding to the 25% of the overall dataset. Eventually, 17 random maps for each macro-area were thus obtained. Additional 4 maps for the south-east-central macro-area were added since, once the sub-sample was georeferenced, it was realized that there was a disparity in size between the maps belonging to this macro-area and those falling in the northern sector of Malta. The addition was aimed at possibly correcting that disparity by slightly widening the data from the underrepresented sector.
An example of the georeferenced and digitized maps is shown in the picture to the right. |
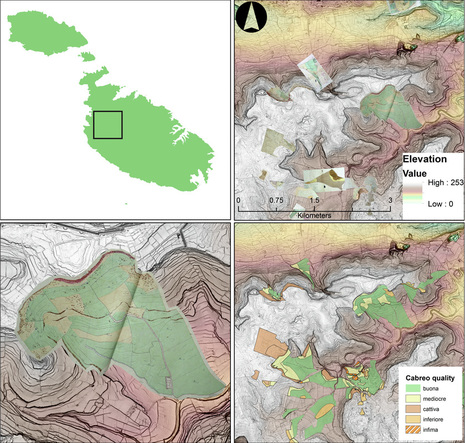
Example of georeferenced (top-right and bottom-left) and digitized (bottom-right) Cabreo maps for Malta.
|
|
Adding human-related factors as independent variables: additional georeferencing and digitization effort
In anticipation of the selection of the independent variables to be fed into the model, it was decided to also take into account the distance to the urban areas, and the distance to the road network. This implied to locate a survey sheet that could portray Malta in a period as close as possible to the Cabreo data, to georeference it, and to digitize the extent of the cities and villages, as well as primary and secondary roads. For these purposes, we were able to locate a 1895 map. The results of the digitization are shown in the image to the right. Topographic/environmental independent variables For the same reasons detailed in this website's page on the Gozo model, the topographic/environmental factors that will be used as independent variables in the Logistic Regression model are: elevation, slope, cosine of the aspect, sine of the aspect, planar curvature, profile curvature, Compound Topographic Index, Heat Load Index, distance to the spring-line, to the geological faults, to the Wied, to the Ghajin toponyms, to the coast, to the 1895 urban areas, to the main and secondary roads, and finally the geology and soil types. Some of these variables are portrayed in the figure below. |
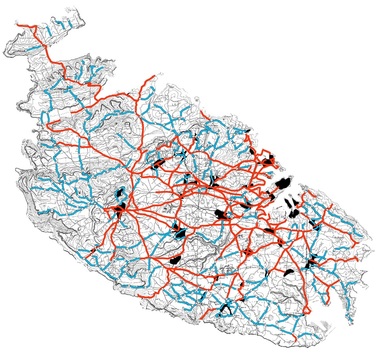
1895 Survey Sheet of Malta, georeferenced into ArcGIS. Digitized urban areas (black), main (red), and secondary roads (blue) are shown.
|
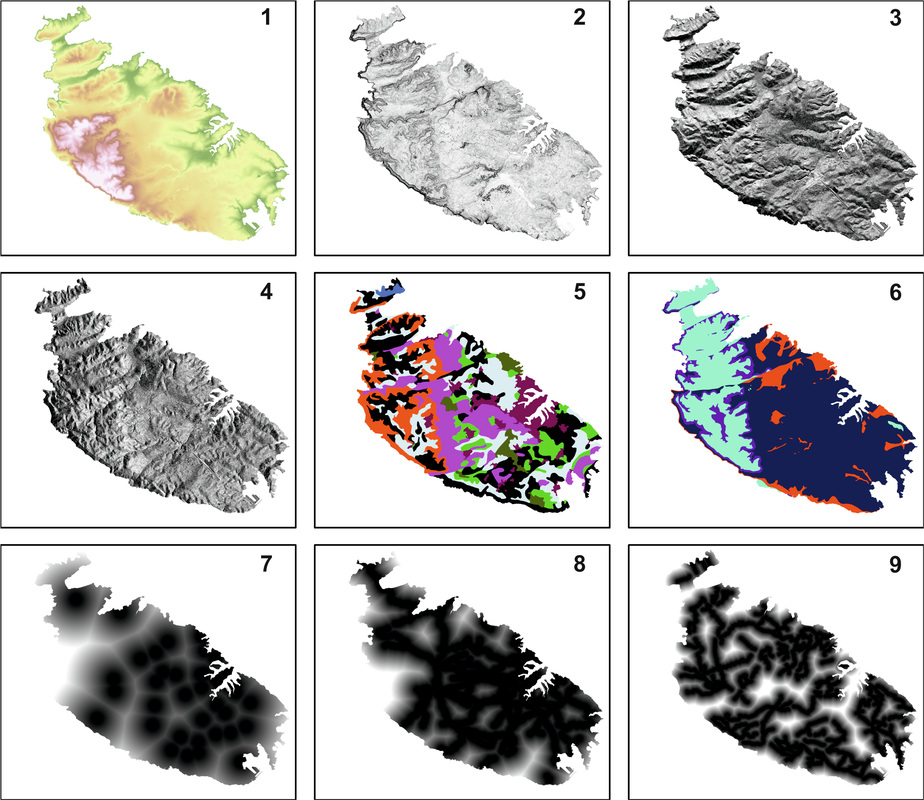
Some of the independent variables to be used in the Cabreo model for Malta: elevation (1), slope (2), cosine of the aspect (3), sine of the aspect (4), soil types (5), geology (6), distance to the 1895 urban areas (7), distance to the 1895 main (8) and secondary roads (9).
